Performance Analysis
Intel VTune Profiler
To analyze which kind of kernels have been called, and from where these kernels have been invoked (call stack), the library allows profiling its JIT code using Intel VTune Profiler. To enable this support, VTune's root directory needs to be set at build-time of the library. Enabling symbols (SYM=1 or DBG=1) incorporates VTune's JIT Profiling API:
source /opt/intel/vtune_profiler/vtune-vars.sh
make SYM=1
Above, the root directory is automatically determined from the environment (VTUNE_PROFILER_*DIR or VTUNE_AMPLIFIER*_DIR with older versions). This variable is present after source'ing the Intel VTune environment (source /path/to/vtune_amplifier/amplxe-vars.sh with older version), but it can be manually provided as well (make VTUNEROOT=/path/to/vtune_amplifier). Symbols are not really required to display kernel names for the dynamically generated code, however enabling symbols makes the analysis much more useful for the rest of the (static) code, and hence it has been made a prerequisite. For example, when "call stacks" are collected it is possible to find out where the JIT code has been invoked by the application:
vtune -r resultdir -data-limit 0 -collect hotspots \
      -knob enable-stack-collection=true \
      -knob sampling-mode=hw \
      -knob stack-size=0 \
      -- ./myapplication
In case of an MPI-parallelized application, it can be useful to only collect results from a "representative" rank, and to also avoid running the event collector in every rank of the application. With Intel MPI both of which can be achieved by:
mpirun -gtool 'vtune -r resultdir -data-limit 0 -collect hotspots \
               -knob sampling-mode=hw -knob enable-stack-collection=true \
               -knob stack-size=0:4=exclusive' \
  [...] ./myapplication
The :4=exclusive is related to Intel MPI or mpirun's gtool arguments and unrelated to VTune's command-line syntax (see vtune --help or amplxe-cl --help with older versions); such argument(s) need to appear at the end of the gtool-string. For instance, the shown command-line selects the 5th rank (zero-based) along with exclusive usage of the performance monitoring unit (PMU) such that only one event-collector runs for all ranks (without rank-number, all ranks are sampled).
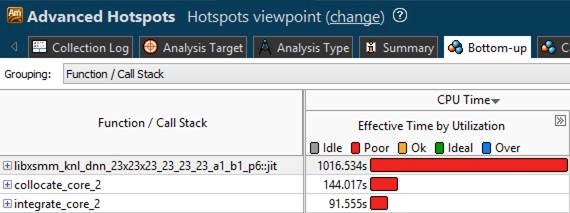
Intel VTune Profiler presents invoked JIT code like functions, which belong to a module named "libxsmm.jit". The function name as well as the module name are supplied by LIBXSMM using VTune's JIT-Profiling API. Below, the shown "function name" (libxsmm_knl_dnn_23x23x23_23_23_23_a1_b1_p6::mxm) encodes an AVX-512 ("knl") double-precision kernel ("d") for small dense matrix multiplication, which performs no transposes ("nn"). The name further encodes M=N=K=LDA=LDB=LDC=23, Alpha=Beta=1.0, and a prefetch strategy ("p6").
An application that cannot rely on LIBXSMM's build system can apply -DLIBXSMM_VTUNE=2 during compilation, and link against ${VTUNE_AMPLIFIER_XE_2017_DIR}/lib64/libjitprofiling.a.
Linux perf
With LIBXSMM, there is both basic (perf map) and extended support (jitdump) when profiling an application. To enable perf support at runtime, the environment LIBXSMM_VERBOSE needs to be set to a negative value.
- The basic support can be enabled at compile-time with PERF=1 (implies SYM=1) using
make PERF=1. At runtime of the application, a map-file ('jit-pid.map') is generated ('/tmp' directory). This file is automatically read by Linux perf and enriches the information about unknown code such as JIT'ted kernels. - The support for "jitdump" can be enabled by supplying JITDUMP=1 (implies PERF=1) or PERF=2 (implies JITDUMP=1) when making the library:
make JITDUMP=1ormake PERF=2. At runtime of the application, a dump-file ('jit-pid.dump') is generated (in perf's debug directory, usually$HOME/.debug/jit/) which includes information about JIT'ted kernels (such as addresses, symbol names, code size, and the code itself). The dump file can be injected intoperf.data(usingperf inject -j), and it enables an annotated view of the assembly in perf's report (requires a reasonably recent version of Linux perf).